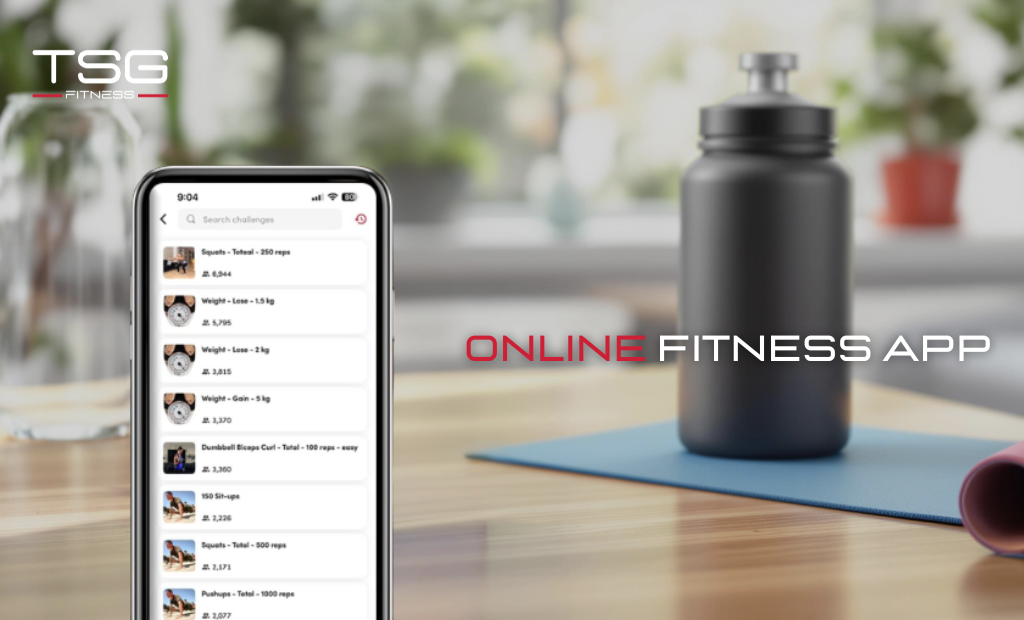
Top 7 Dashboard Metrics You Should Monitor in Your Online Fitness App
Monitoring the right metrics within your TSG Fitness online app transforms raw data into actionable insights, empowering you to optimize workouts, nutrition, and recovery. Below are the seven key indicators every TSG app user should track to ensure continuous progress and sustained motivation.
1. Weekly Workout Completion Rate
This metric shows the percentage of scheduled workouts you complete each week. High completion rates correlate strongly with goal achievement. Strive for at least 80% adherence, and use missed-session data to identify scheduling conflicts or program fatigue.
2. Training Volume and Intensity Trends
TSG’s volume tracker records total sets, reps, and training load, while the intensity indicator measures average training difficulty. Monitoring weekly volume alongside perceived exertion scores helps you balance progressive overload with adequate recovery, preventing plateaus and overtraining.
3. Macro Nutrient Adherence
Your TSG app displays daily and weekly percentages for protein, carbohydrates, and fats consumed versus targeted macros. Consistent macro adherence ensures optimal fueling for performance and recovery. Trends below 90% warrant meal-plan adjustments or portion-control strategies.
4. Body Composition Changes
By integrating InBody data, the app charts lean mass, fat mass, and body fat percentage over time. Tracking these metrics rather than scale weight alone reveals true body transformation, allowing you to fine-tune nutrition and training for recomposition goals.
5. Resting Heart Rate and Heart Rate Variability
The dashboard aggregates daily resting heart rate (RHR) and heart rate variability (HRV) from wearable integrations. Rising RHR or falling HRV can indicate insufficient recovery or excessive stress. Use these insights to adjust training intensity or prioritize recovery modalities like mobility work and sleep optimization.
6. Workout Performance Benchmarks
TSG’s performance tracker logs personal records such as 1RM lifts, fastest mile times, or highest rep counts for key exercises. Visualizing PR trends motivates continued progression and informs program periodization, ensuring workouts evolve in line with your capabilities.
7. Engagement and Consistency Scores
This composite metric reflects your frequency of app logins, coach communications, nutrition log updates, and community challenge participation. High engagement scores correlate with better adherence and outcomes. If your score dips, set small daily check-in goals or join TSG’s virtual cohort challenges to reignite consistency.
FAQs
Q: How often should I review these dashboard metrics?
A: Check completion rate, nutrition, and engagement daily or weekly. Assess body composition, RHR/HRV, and performance benchmarks every 2–4 weeks.
Q: What if my adherence metrics fall below targets?
A: Review scheduling, adjust workout difficulty, and consult your TSG coach for meal-plan tweaks. Small, incremental changes prevent overwhelm.
Q: Can I customize which metrics appear on my dashboard?
A: Yes. The TSG app settings allow you to prioritize the metrics most relevant to your goals, hiding less pertinent data.
Q: How does TSG ensure data accuracy?
A: TSG integrates with validated devices (InBody scanners, certified wearables) and uses real-time coach verification to maintain high data integrity.
Q: What action should I take if recovery metrics (RHR/HRV) indicate poor recovery?
A: Reduce training intensity, add an extra rest day, improve sleep hygiene, and incorporate active recovery sessions guided by your TSG coach.
Q: How do engagement scores affect my training program?
A: Low engagement triggers proactive coach outreach, personalized motivation strategies, and community challenge invites to boost accountability.
Tracking these seven metrics in your TSG online fitness app ensures a data-driven approach to your health journey, optimizing workouts, nutrition, and recovery for sustainable, measurable results.


